When performing recruitment processes, it is important to keep track of all the important data, like the number of applicants your company received, their origin, percentage of hires, among other relevant information. This type of information can be helpful to perceive the success of a hiring process and to perfect methods in the future, if necessary.
However, keeping track of this kind of data can be complicated if it’s done manually without the help of an Applicant Tracking System (ATS). Long work hours focused on analysing data can lead to tiredness and mistakes, causing a misreading of information and, consequently, performance problems in future hiring processes. In order to prevent this, skeeled offers a Key Performance Indicators (KPI) tool that easily allows you to access relevant data regarding all your recruitment processes.
With skeeled’s KPI’s, you can easily create graphs and reports that will show you all your personalised statistics and data. From the number of applicants to average time to hire, in the last year or in the last month, you can choose the metrics you wish to evaluate and easily create a visual representation of them, according to your needs.
How to Use KPI’s with skeeled, Step-by-Step:
- When opening the KPI’s dashboard, you will get an overview of all the metrics you’ve already created.
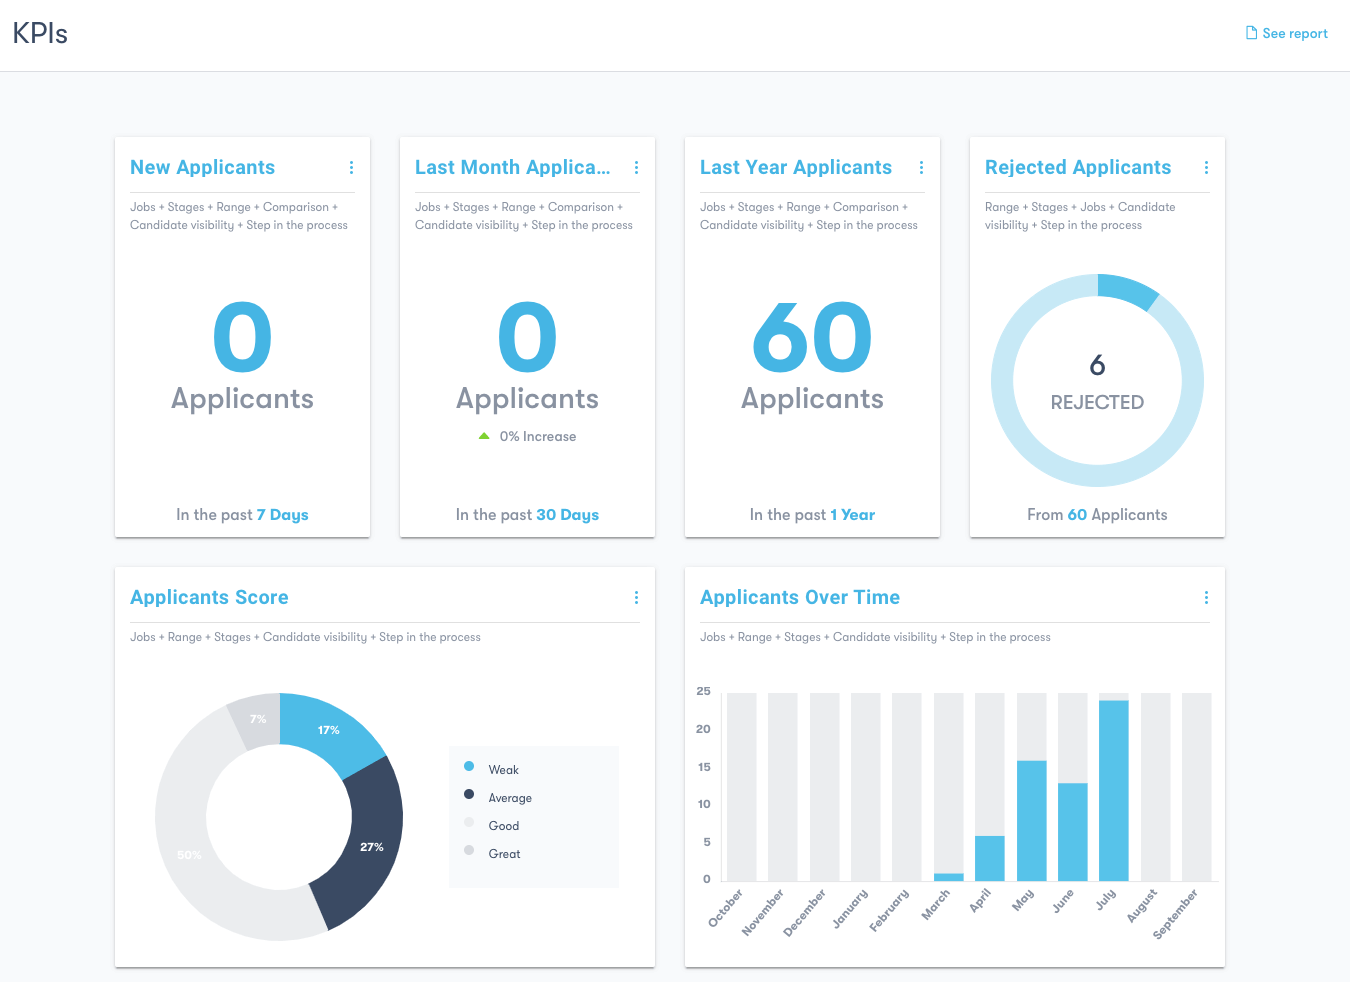
- To see the options of an already existent metric, click on the three dots on the top right corner of the chart of your choice.
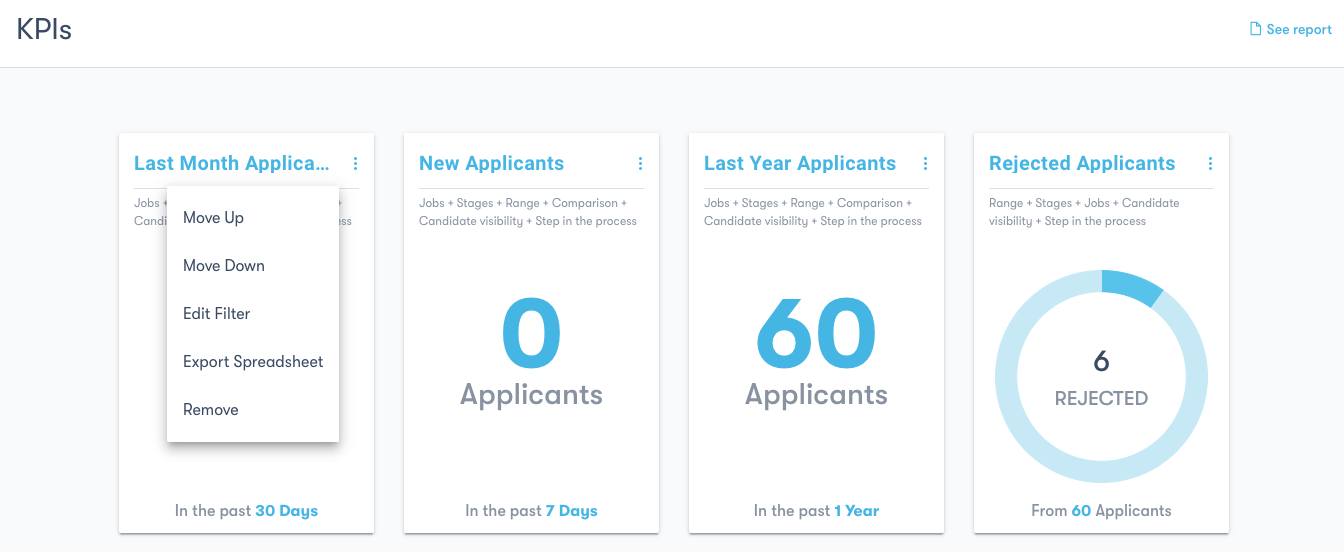
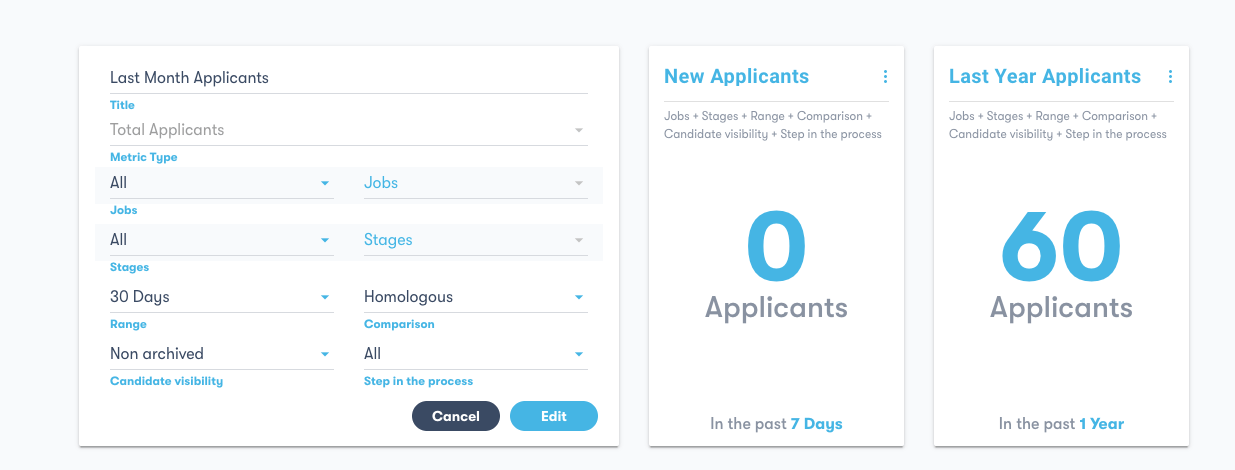
Click on Move Up or Move Down to change the order in which the charts appear. Edit Filter will allow you to change the metrics analysed on that specific chart.
Export Spreadsheet will give you an excel document with the metrics of that chart and Remove will delete the chart of the dashboard.
- To see a new metric analysis, click on Add New Metric.
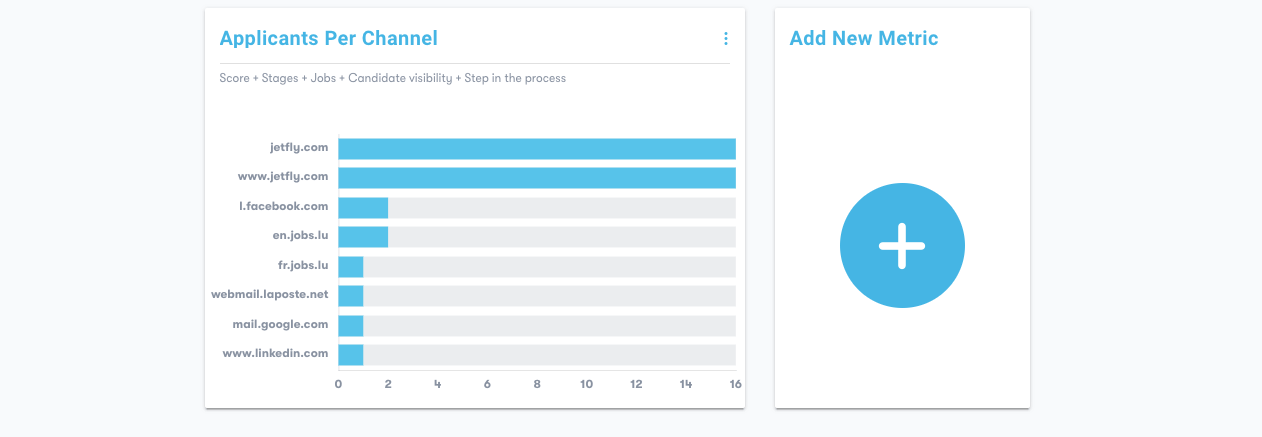
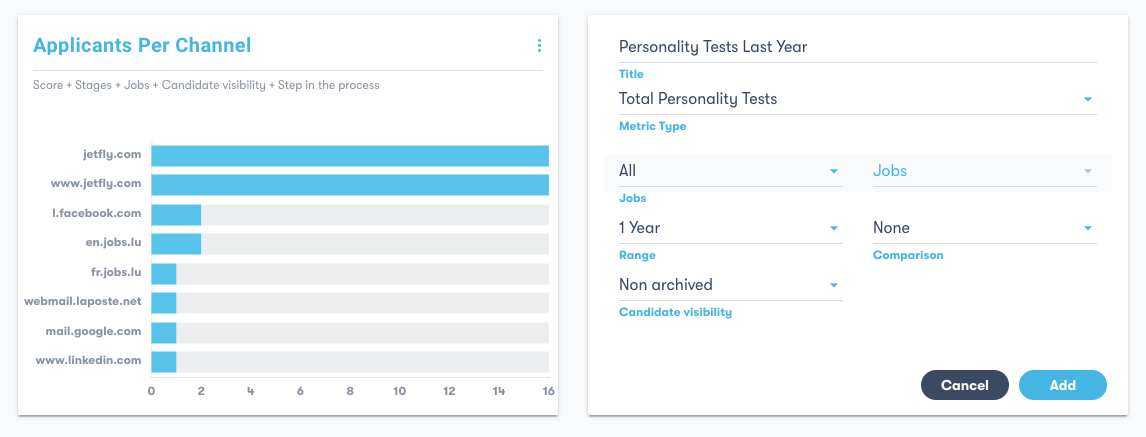
- Choose a name for the new metric and select the data you wish to analyse, like the Total Applicants, Applicants Per Channel, Number of Clicks per Campaign Channel, among others.
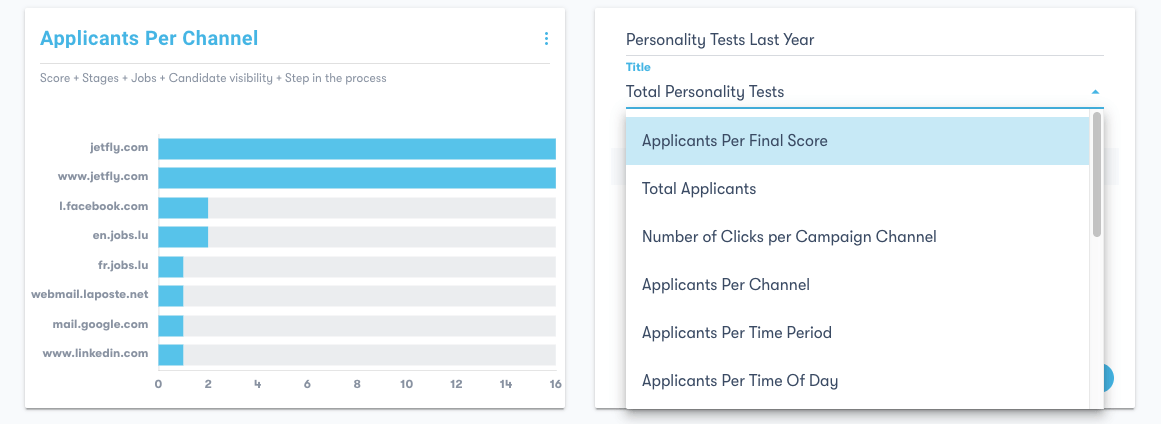
Once you have chosen the metric, choose the specific filters according to your needs. You can later change these filters. Finally, click on Add to create the metric.
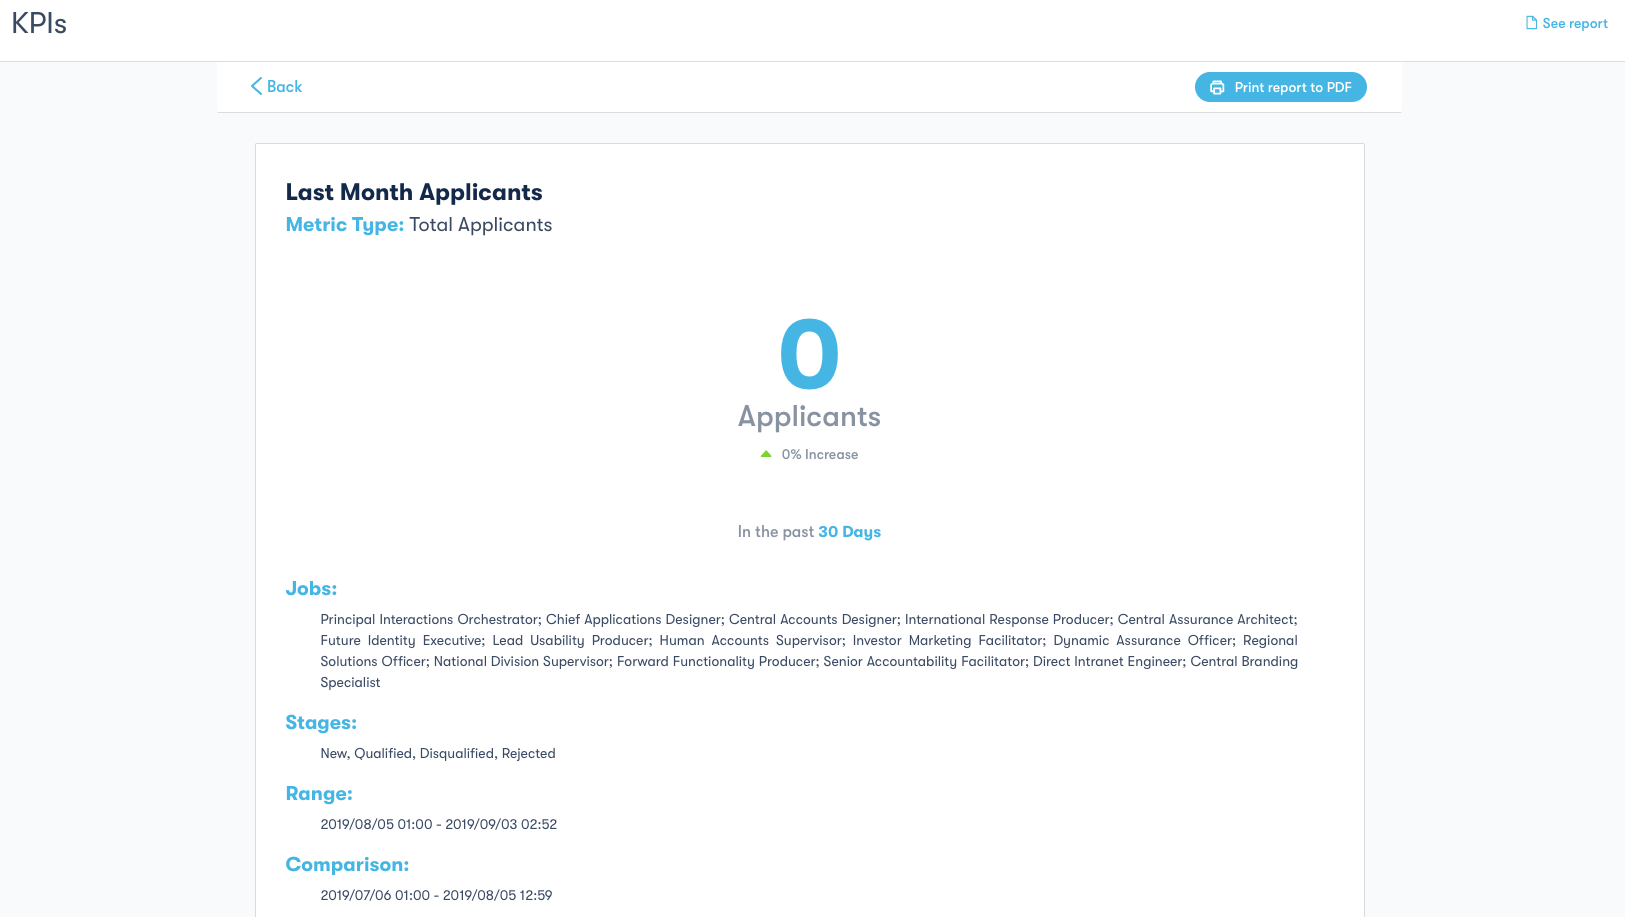
- Click on See Report, on the top right corner of the screen, to see more detailed information on each metric that you previously created. You can also convert the information displayed into a PDF document if you wish to print. To do that, just click on Print report to PDF.
Take Full Advantage of skeeled
As you could see, skeeled’s software allows you to analyse relevant data regarding your recruitment processes in order for you to easily measure your performance and adapt your strategy if necessary.
Watch our video to learn more about how to use KPI’S on skeeled: https://www.youtube.com/watch?v=6m-kO0d8Uk8&feature=youtu.be
*Previous how-to articles:
How to get started with skeeled?
How to Manage a Recruiting Team on skeeled?
How to Create Recruiting Email Templates on skeeled?
How to Build an Agile Recruitment Workflow With skeeled?
How to Manage and Share Jobs on skeeled?
How to Manage Applicants with skeeled?
How to Manage Spontaneous Applicants with skeeled?
How to use Multiposting with skeeled?

Skeeled offers you the perfect opportunity to bring innovation and digitalisation to your hiring. Check our website or our LinkedIn, Twitter and Facebook pages for further information.
Thanks for reading and see you next time!
Your team here at skeeled


